
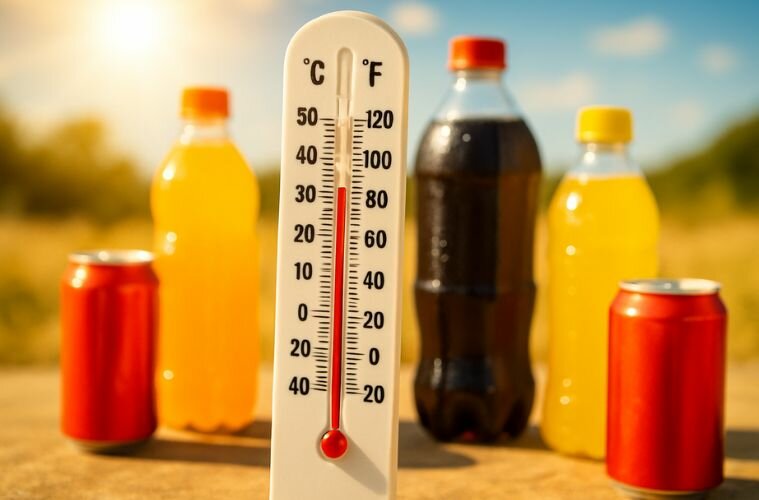
“In our results, the critical need is to mitigate health risks from the over-intake of added sugar and to explore dietary adaptation to climate change,” wrote Pan He and colleagues in Nature Climate Change.
Excess added sugar elevates risks for obesity, type 2 diabetes, and cardiovascular disease—conditions that already drive the bulk of U.S. medical spend. The CDC estimates 90% of the nation’s $4.9T annual health care expenditures go to people with chronic and mental health conditions. The American Heart Association recommends ≤25 g/day of added sugar for most women and ≤36 g/day for most men; many Americans exceed these limits.
For businesses with outdoor or frontline workforces—construction, utilities, logistics, manufacturing—the paper flags a climate-sensitive consumption shift toward ready-to-drink sweetened beverages, the dominant driver of heat-linked sugar increases; frozen desserts contribute modestly. Employers already planning for heat stress and hydration should recognize that product mix and access during hot periods can nudge consumption patterns in the wrong direction.
The temperature–sugar link is stronger among lower-income and lower-education households, with responsiveness tapering off at higher socioeconomic status—likely due to more stable micro-environments (air-conditioned workplaces) and healthier defaults. That makes this not only a public-health issue but a workforce equity and benefits-cost issue for employers with large hourly workforces or outdoor operations.
Geographically, the largest projected increases by century’s end occur in northern U.S. counties, where warming shifts baseline temperatures into the 12–30 °C band where the sugar response is steepest. Seasonal spikes are most pronounced in summer and autumn.
Evaluations across U.S. cities show SSB taxes drive consistent drops in purchases, with ~92% price pass-through to consumers and meaningful volume declines—evidence that fiscal levers can curb heat-amplified sugar intake. The WHO’s 2023 global report documents accelerating adoption and provides design guidance that could spread to additional jurisdictions—affecting pricing, mix, and marketing.
From a risk lens, consider the growing literature linking SSBs to global cardiometabolic burdens. A 2025 Nature Medicine analysis quantified country-level burdens across 184 nations, reinforcing why climate-amplified sugar intake matters for employers, payers, and brands.
Unlike prior supply-side climate–nutrition work, this paper quantifies demand-side shifts in the U.S. using longitudinal retail scanner data (Nielsen Homescan), maps the nonlinear temperature response (steepest between 12–30 °C, ~0.70 g/°C), and isolates beverages as the primary driver—then projects century-end impacts under CMIP6 scenarios.


